We asked a quantum computer which parties should govern New Zealand after 7 November 2026. Here is what it said.
Everything described here is open source: https://github.com/spinsphere/nz-quantum-election
Every election, pundits argue about who will go into coalition with whom. This year I tried something different. Instead of asking who wants to govern together, I asked which combination of parties should, if the only things that counted were the published evidence on their policies, how far apart they sit from one another, and the seat maths from the latest polls. Then I turned that question into a numerical optimisation problem and handed the optimisation problem to a quantum computer.
The answer
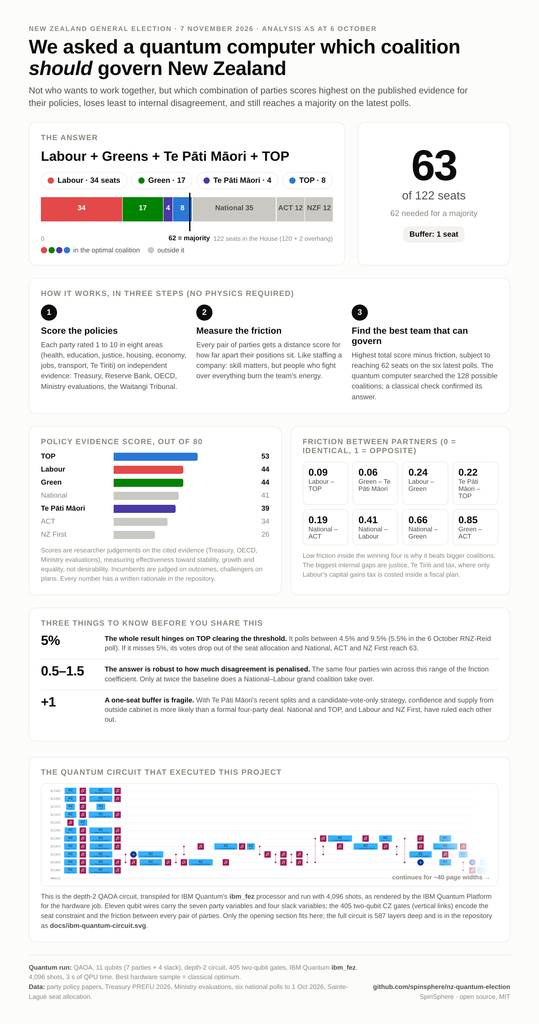
Labour, the Greens, Te Pāti Māori and TOP (the Opportunity Party), with 63 of a projected 122 seats. One seat more than the 62-seat majority required. The 122-seat projection includes two Te Pāti Māori overhang seats.
The runners-up were a long way back: National plus Labour plus TOP, then a National-Labour grand coalition. The current National, ACT and NZ First government comes out at 59 seats on the poll average and cannot get to 62 without TOP, which National has ruled out. NZ First and Labour have ruled each other out too. So the arithmetic and the evidence point the same way, with one enormous caveat I’ll come back to: today’s RNZ-Reid Research poll has TOP at 5.5%, half a point above the 5% threshold (the six-poll average the model uses is 6.4%), and if it slips under, the whole picture flips to a National-led majority.
How it works, without the physics
Think of the seven parties as seven people you might invite to run a company together. Each one brings a skill score, based on how well their plans would actually work. But every pair of them also has a friction cost: two people who disagree about everything will spend the company’s energy fighting. You want the team with the highest total skill minus friction, and it has to be big enough to carry the vote at the board, meaning 62 seats.
One thing to be clear about before the steps: the seat allocation, the friction calculation and the coalition search are mechanical, but the policy scores and ideological positions are my judgements, made on the cited evidence and written down cell by cell so anyone can challenge them. No institution produced those numbers.
That is the whole model:
- Skill. Each party was scored from 1 to 10 in eight areas: health, education, crime and justice, housing, cost of living and the economy, employment, transport and infrastructure, and Te Tiriti o Waitangi. The question for every score was the same: based on independent evidence (Treasury, the Reserve Bank, OECD, Ministry evaluations, the Waitangi Tribunal, academic research), how effectively would this party’s stated 2026 policies, and its record where it has governed, advance stability, growth and equality? Totals out of 80: TOP 53, Labour 44, Greens 44, National 41, Te Pāti Māori 39, ACT 34, NZ First 26.
- Friction. Each party was also placed on a left-right style scale in each of the eight areas, not to judge it but to measure distance. National and ACT are close (0.19 on a 0 to 1 scale). Labour and TOP are very close (0.09). The Greens and ACT are about as far apart as it gets (0.85).
- Seats. The six most recent national polls were averaged, including this morning’s RNZ-Reid Research poll, and converted to seats with the same Sainte-Laguë method the Electoral Commission uses, assuming Te Pāti Māori keeps four Māori electorates as every published projection does.
The computer’s job was to try every combination of the seven parties and find the one with the highest skill minus friction that still reaches 62 seats. There are only 128 combinations, so a laptop can check them all in a blink, and mine did, as a cross-check. The point of using a quantum computer was not speed. It was to build a complete, auditable pipeline from policy evidence to a quantum circuit running on real hardware, and to see how well today’s quantum machines handle a constrained problem with a real-world shape.
Why this is a different way to look at politics
Most coalition commentary works backwards from personalities and deals. This works forwards from published evidence, interpreted through an explicit scoring framework. Three things fall out of that which commentary tends to miss.
The answer is robust to how much you penalise disagreement. I ran the model with the friction penalty set anywhere from half to one and a half times its baseline, and the same four-party coalition won every time. Only when disagreement is penalised at twice the baseline does the model switch to a National-Labour grand coalition, because two partners generate less friction than four. That switch point is a useful number: it is the quantitative version of “if the small parties are impossible, the big two will have to talk.”
Scores cut across party lines. National’s structured-literacy programme scores well because ERO has reported encouraging early results from the phonics and structured-literacy changes. Its sentencing laws score poorly because the Ministry of Justice projects a 35% rise in the prison population with weak deterrence evidence. The Greens’ 2% rent cap scores poorly because a substantial body of economic evidence finds strict rent controls reduce rental supply, maintenance and efficient allocation. Te Pāti Māori’s health chapter scores better than its justice chapter. ACT’s plan to lift medicines spending one point a year to Australia’s level by 2033 is one of the more explicitly quantified health policies on offer. Nobody gets a free pass and nobody gets written off.
The friction map tells you where a government would crack. Inside the winning four, the biggest gaps are on justice (Te Pāti Māori’s prison-abolition goal against Labour’s near silence), Te Tiriti (binding Tribunal recommendations against Treaty impact analysis) and tax, where four different philosophies exist and only Labour’s narrow capital gains tax is costed inside a fiscal plan. Labour has ruled out any other new tax. The concessions each party would need to make are listed in the report, domain by domain.
What the result does not say
It does not say who will win. Polls move, and the model is a snapshot of six of them. It does not say the winning coalition would be stable: a one-seat buffer, Te Pāti Māori’s recent instability (two MPs expelled in 2025, a breakaway party in 2026) and a candidate-vote-only strategy that depends on supporters splitting their vote all point to confidence and supply from outside cabinet rather than a formal four-party deal. And it does not say what you should value. The scores measure evidence-based effectiveness toward stability, growth and equality. If you weight fiscal discipline over equality, or vice versa, you can change the numbers in one file and re-run it.
The technical part: how the calculation was actually done
For the quantum-curious. Everything below is reproducible from the repository.
The data. Eight research passes (one per party, one for polling) gathered policy detail with a source for every claim, then the full policy papers were pulled directly: TOP’s Tax Reset with its costing table, the Greens’ 2026 tax paper modelled by the Parliamentary Library and reviewed by Infometrics, Te Pāti Māori’s manifesto chapters on health, justice, tax, housing and Te Tiriti, Labour’s fiscal plan and Medicard costings, National’s policy and outcome data including Treasury’s PREFU 2026, ERO’s curriculum evaluation and the boot-camp evaluation, and a 67-page news crawl covering coalition rule-outs, Māori-electorate polls and independent economist assessments. Every score has a written rationale in policy_data.json. Coverage is strongest for National (incumbents are judged on outcomes) and weakest for NZ First.
The objective. Maximise Σ wᵢxᵢ − μ Σ dᵢⱼxᵢxⱼ subject to Σ sᵢxᵢ ≥ 62, where xᵢ is 1 if party i is in the coalition, wᵢ is its score out of 80 expressed as a fraction, dᵢⱼ is the mean absolute distance between two parties’ positions across the eight domains (scaled to 0 to 1), sᵢ is its seats, and μ = 1 is the friction coefficient. Without the friction term the problem is degenerate: every party has positive value, so the “optimal” coalition is all seven. The friction term is what turns a trivial knapsack into a genuine binary quadratic program, which is the class of problem the Quantum Approximate Optimisation Algorithm (QAOA) is designed for.
The encoding. The seat constraint becomes an equality with binary slack variables. Raw seat counts (35, 34, 17, 12, 12, 4, 8) would need six slack qubits and produce penalty coefficients hundreds of times larger than the objective, which is why low-depth QAOA struggles with knapsack constraints. The script searches for the coarsest integer unit that reproduces the exact feasible set for all 128 coalitions; six seats per unit works (6, 6, 3, 2, 2, 1, 1 against a majority of 11), cutting the problem to 7 party qubits plus 4 slack qubits, 11 in total, and shrinking the penalty range tenfold. The penalty weight is chosen by computing the exact ground state over all 2,048 basis states and taking the smallest value for which it equals the constrained optimum.
The circuit. Qiskit’s QAOAAnsatz with the standard X mixer, depths 1 to 4. Angles were optimised with COBYLA against the exact expectation value from an Aer statevector simulation, with linear-ramp starting points and warm starts from the previous depth. The depth-4 circuit was sampled 8,192 times on Aer. The depth-2 circuit, with its optimised angles, was transpiled to 405 two-qubit gates and run on IBM’s ibm_fez processor (156 qubits) with 4,096 shots, dynamical decoupling and gate twirling. Zero queue, 12 seconds wall time, 3 seconds of QPU time on IBM’s free Open plan. Two earlier runs, on ibm_marrakesh and ibm_fez, gave the same answer; a fourth attempt hit an IBM internal error and fell back to the simulator as designed.
What the quantum machine did and did not do. It learned the majority constraint well: 88% of ideal samples at the same depth as the hardware run (87% for the final depth-4 sample) and 66% of hardware samples were majority coalitions, against 50% for uniform random sampling (64 of the 128 coalitions reach a majority). It only weakly resolved the policy objective at these shallow depths. In the ideal depth-4 simulation the exact optimum bitstring carried about 5.8 times the probability of a uniform basis state; the depth-2 hardware run managed about 2.5 times uniform. The penalty term still dominates the energy landscape even after rescaling, a known limitation of penalty-based QAOA. The optimum was nevertheless recovered by post-selecting the best feasible sample, which is how QAOA is used in practice, and it matched the brute-force answer on both simulator and hardware. There is no quantum speed-up on a 128-coalition problem, and I would distrust anyone who claimed one.
Robustness. Friction coefficient from 0.5 to 1.5: same coalition. At 2.0 and above: National-Labour. If TOP falls below 5% without winning an electorate, its party vote no longer takes part in the Sainte-Laguë allocation. On the same underlying vote shares the projected House stays at 122, the optimal coalition without TOP holds 59 seats, short of a majority, and National, ACT and NZ First rise to 63. The report prints this scenario automatically.
Reproduce it. pip install -r requirements.txt, then python quantum_nz_election.py and python generate_report.py. Edit the scores, positions or poll numbers in policy_data.json to test your own view. The IBM token is optional; without it the script falls back to the local simulator.
This is a mathematical exercise using publicly available policy information. It is not an endorsement of any party. The policy scores are not measurements produced by Treasury or any other institution; they are documented researcher judgements based on the cited evidence. The seat allocation, friction calculation and coalition optimisation are mechanical once those inputs are supplied.
 English
 日本語
日本語 简体中文
简体中文 한국어
한국어